Selected RMG analytics dashboards, focused on capacity, production performance and fabric availability.
01 / CAPACITY PLANNING
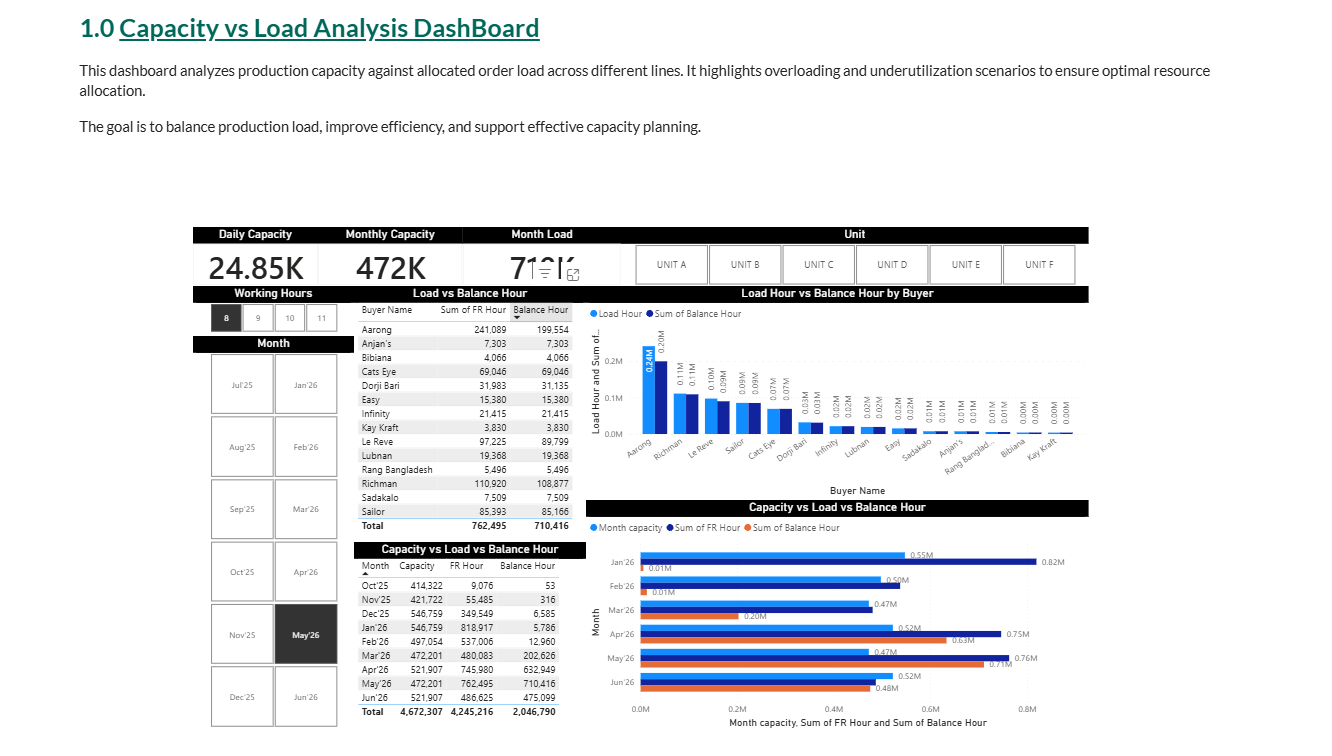
Capacity vs Load Analysis
Dashboard preview · select image to enlarge
This dashboard compares production capacity with allocated order load across lines. It highlights overloading and underutilization to support resource allocation and load balancing.
The question
Where does planned work exceed available capacity, and where is capacity unused?
What it shows
Daily and monthly capacity, monthly load, working hours, buyer-level load and balance-hour comparisons.
Decision support
Review capacity and load together before adjusting production allocations.
02 / PRODUCTION PERFORMANCE
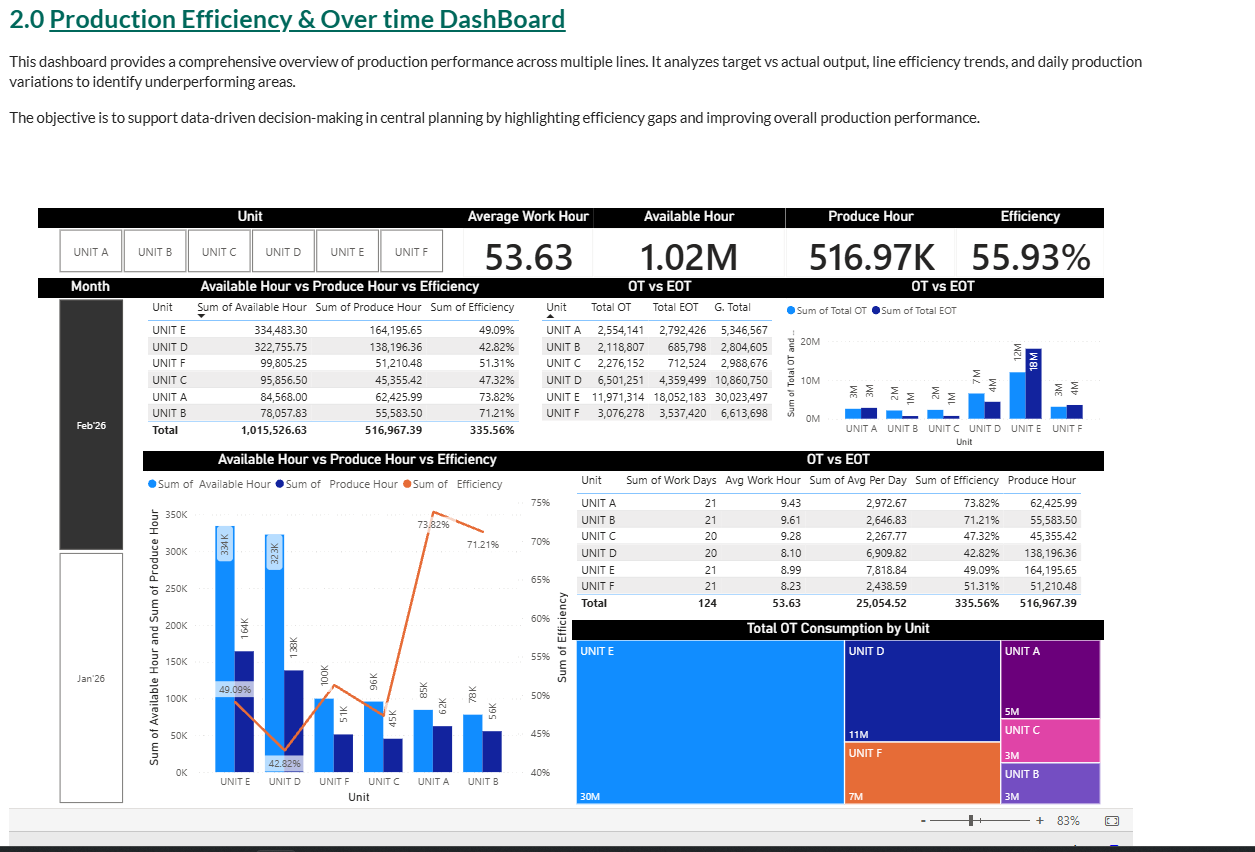
Production Efficiency & Overtime
Dashboard preview · select image to enlarge
A production performance overview across units, comparing available and produced hours, efficiency and overtime consumption.
The question
Which units show efficiency gaps, and how is overtime distributed?
What it shows
Working hours, available hours, produced hours, efficiency, OT vs EOT and unit-level overtime.
Decision support
Investigate performance variation and prioritize operational follow-up.
03 / MATERIAL & SHIPMENT RISK
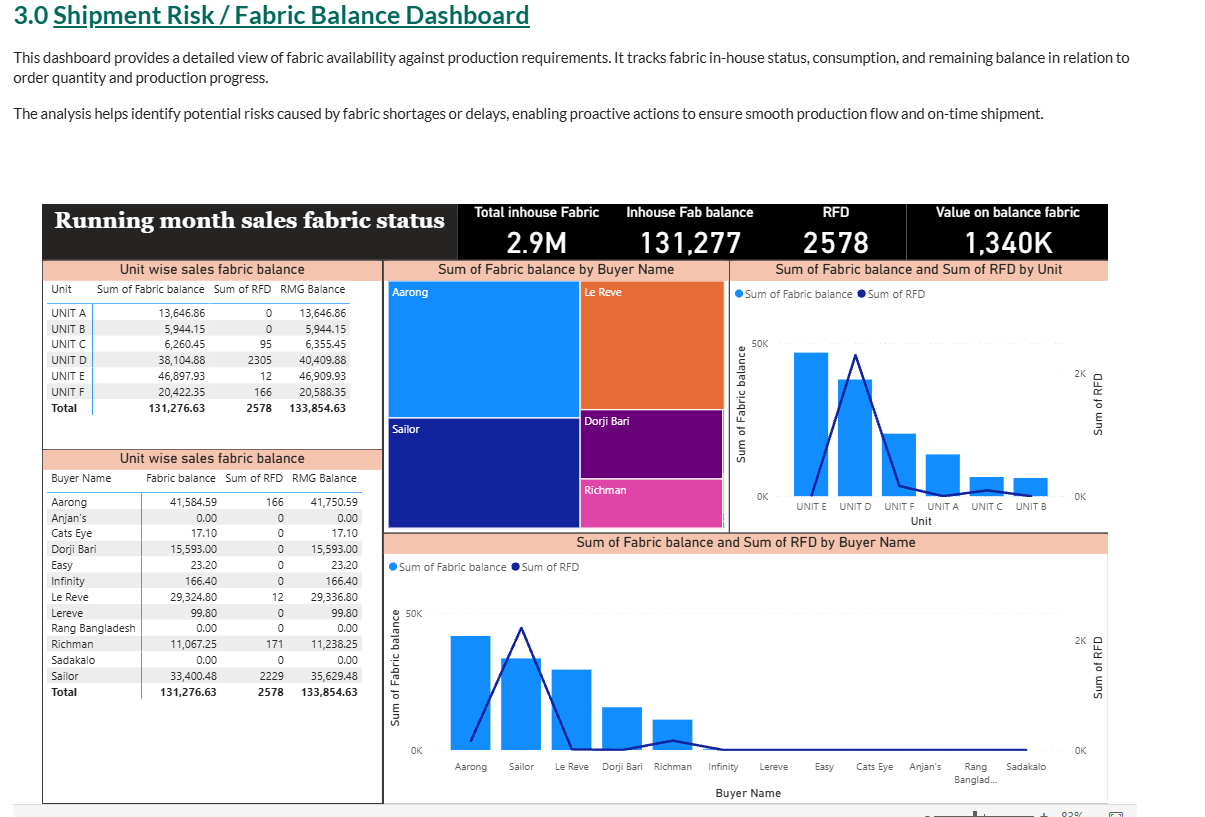
Shipment Risk / Fabric Balance
Dashboard preview · select image to enlarge
This dashboard reviews fabric availability against production requirements, with in-house status and remaining balance in the context of orders and production progress.
The question
Could fabric shortages or delays affect production and shipment?
What it shows
In-house fabric, fabric balance, RFD and balance comparisons by buyer and unit.
Decision support
Identify potential material constraints for proactive follow-up.
সক্ষমতা, উৎপাদন দক্ষতা এবং কাপড়ের প্রাপ্যতা নিয়ে আমার নির্বাচিত RMG অ্যানালিটিক্স ড্যাশবোর্ড।
১ / Capacity vs Load Analysis
Dashboard preview · select image to enlarge
লাইনভিত্তিক উৎপাদন সক্ষমতার সঙ্গে বরাদ্দ করা অর্ডার লোড তুলনা করে অতিরিক্ত চাপ এবং অব্যবহৃত সক্ষমতা চিহ্নিত করে। দৈনিক ও মাসিক সক্ষমতা, মাসিক লোড, কর্মঘণ্টা এবং বায়ারভিত্তিক ব্যালেন্স আওয়ার দেখা যায়। লোড ব্যালেন্সিং ও রিসোর্স বণ্টনের সিদ্ধান্তে এটি সহায়ক।
২ / Production Efficiency & Overtime
Dashboard preview · select image to enlarge
ইউনিটভিত্তিক উপলব্ধ ঘণ্টা, উৎপাদিত ঘণ্টা, দক্ষতা এবং ওভারটাইমের তুলনা দেখায়। দক্ষতার ঘাটতি কোথায় এবং ওভারটাইম কীভাবে বণ্টিত হচ্ছে তা বোঝা যায়। পারফরম্যান্সের পার্থক্য অনুসন্ধান ও প্রয়োজনীয় ফলোআপ নির্ধারণে সহায়তা করে।
৩ / Shipment Risk / Fabric Balance
Dashboard preview · select image to enlarge
অর্ডারের চাহিদা ও উৎপাদন অগ্রগতির সঙ্গে কাপড়ের প্রাপ্যতা পর্যালোচনা করে। ইনহাউস কাপড়, অবশিষ্ট ব্যালেন্স, RFD এবং বায়ার ও ইউনিটভিত্তিক তুলনা দেখা যায়। সম্ভাব্য ঘাটতি বা বিলম্ব চিহ্নিত করে আগে থেকেই ব্যবস্থা নিতে সহায়তা করে।
মূল পোর্টফোলিও দেখুন ↗একই ধরনের কাজ নিয়ে আলোচনা করুন